How Many Homes Are Sold in the US Each Year?
It’s safe to say that the US housing market is the heartbeat of the American economy. When it’s booming, the whole country feels the rush; when it slows down, everyone holds their breath. While we obsess over fluctuating home prices and track mortgage rates on a daily basis, the ultimate measure of the market’s true velocity is simple volume: total transactions. After all, a high price tag means very little if buyers and sellers are frozen in place.
The volume of annual transactions in real estate has become the definitive factor of consumer confidence. So, how many homes are actually sold in the US every year? Is the market currently running a fever, or is it cooling down to a steady walk?
What Is the Current Number of Homes Sold per Year in the US?
Historically, existing home sales make up around 85% to 90% of the market. Newly constructed homes, on the other hand, account for the remaining 10% to 15%, with average transaction prices ranging from $550,000 to $700,000 per year. But why? The thing is, new homes are more expensive because builders must account for fluctuating material costs, stricter modern building codes, and escalating land values. At times, however, when existing homes refuse to sell, newly constructed homes step in to fill the inventory void. During this period, new construction can temporarily shoot up to capture nearly 30% of all single-family homes available for sale.
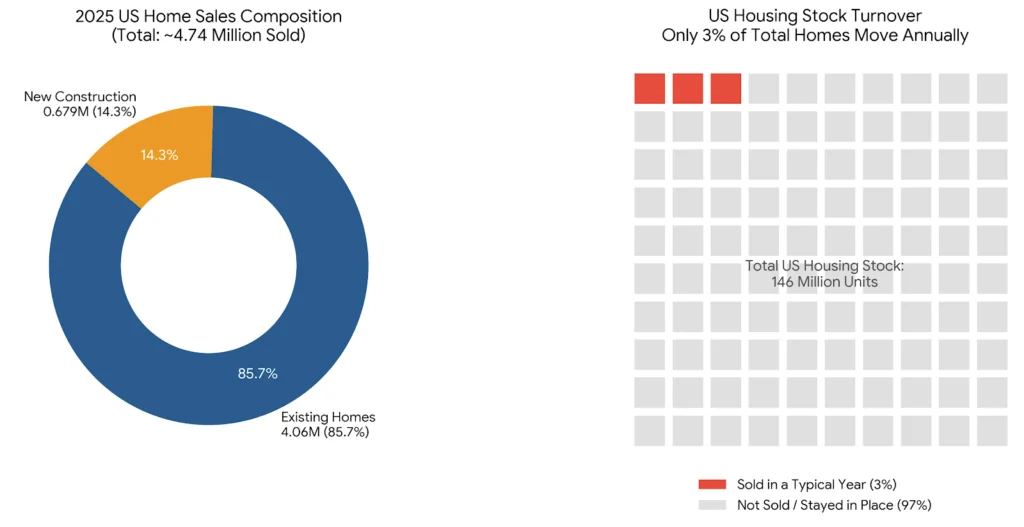
Now let’s answer the main question: how many residences, both existing and recently built, are sold in the US every year? Annual US home sales average between 4 to 5 million transactions. In 2025, about 4.06 million existing homes were sold alongside roughly 679,000 new single-family homes.
While 4 to 5 million homes change hands each year, that represents only a small fraction of the nation’s housing stock. With more than 146 million housing units across the US, only about 3% of the residences are sold in a typical year. In other words, most Americans stay in their homes for years before moving.
How Monthly Home Sales Translate Into Annual Totals
A seasonally adjusted annual rate takes one month of sales, removes predictable seasonal patterns like the spring buying surge or winter slowdown, and projects the result across twelve months. Housing analysts use SAAR because raw monthly numbers bounce around too much to be useful on their own.
In practical terms, if existing home sales run at a SAAR of about 4.17 million in May 2026, that means the country would sell roughly 4.17 million existing homes over a full year if that month’s pace held steady. In May 2026, 308,446 homes were actually sold in the U.S. during that single month. The U.S. housing market saw a 5.2% increase in sales year over year compared to the same period.
Individual months can swing based on weather, mortgage rate changes, and inventory. That’s why to understand how many homes are sold each year, economists typically average monthly SAAR readings across all twelve months rather than fixating on a single report from, say, June or January. A strong March or April can be offset by a weaker September or November, and the annual average smooths those bumps out.
How Home Prices and Mortgage Rates Affect Annual Home Sales
Two forces exert the most influence over how many homes sell in any given year: the sales price of homes and the cost of borrowing money to buy them.
When the national average 30-year fixed mortgage rate falls, more households can qualify for loans. As of May 2026, rates sit around 6.4%, down from about 6.82% a year earlier. That decline has helped, but mortgage rates above 6.5% have significantly suppressed home sales demand throughout 2023–2025. The rate essentially determines monthly payments, and even small movements can shift affordability for millions of households.
On the price side, the median home price in the US, according to Redfin, is $398,771 as of May 2026. U.S. home prices rose 2.0% year over year in May 2026, continuing a pattern of steady appreciation. In 2024, the median home price reached $407,500 due to low inventory and high demand. These record-high price levels, combined with elevated rates, have priced out significant numbers of potential buyers.
The affordability squeeze (when the cost of a residence rises much faster than a typical household’s income) hits unevenly across the country. A $1,000 increase in median price pushes out roughly 9,573 households in Florida, 9,151 in Texas, and 7,243 in California, which clearly shows how sensitive demand is to even modest price changes.
Regional and Demographic Patterns in Annual Home Sales
National totals hide wide variation between regions, metros, and buyer types. The South accounts for roughly 45% of national sales volume in the United States, driven by more affordable land and faster population growth. Sales activity has varied regionally with notable activity in the South and Midwest, while the West has seen relatively unchanged transaction counts in recent months.
In May 2026, median prices varied dramatically by region: the West topped $625,000, the Northeast reached about $535,000, while the Midwest and South remained more moderate. First-time home buyers accounted for about 35% of existing home sales in May 2026, up from 30–33% in prior months. This group is especially sensitive to affordability and tends to gravitate toward markets where median home prices remain closer to the nationwide average.
Migration trends between late 2025 and early 2026 showed roughly 30% of buyers searching for homes in a different metro, with Florida, Arizona, North Carolina, Tennessee, and South Carolina attracting many movers. Cash purchases hovered around 25–30% of all transactions, which reflects continued investor and second-home buyer activity across the country.
Trends and Outlook: Will Annual Home Sales Rise or Fall?
After a pronounced slowdown in 2023–2024, most forecasts project modest growth in annual home sales if mortgage rates gradually ease. Existing home sales in the US are projected at 3,800 thousand by Q2 2026, while in 2027, existing home sales are projected to trend around 3,600 thousand.
Several forces will shape whether annual totals climb back toward 5 million:
- If mortgage rates drift below 6%, inventory increases, and affordability improves, sellers who have been locked into low-rate mortgages may finally list.
- Millennials are entering peak home-buying age, providing a demographic tailwind that could sustain demand for years. Contact with agents and mortgage pre-approvals from this cohort have risen steadily.
- NAR chief economist Dr. Lawrence Yun has emphasized that unlocking more inventory and improving affordability are the two keys to lifting annual home sales from their current low levels. “Homeowners will continue to build wealth, while renters are simply spinning their wheels,” he added.
- New construction calculated at current rates would need to accelerate to offset the existing home shortage, especially in growing metros across the economy.
Risks remain. Persistently high home prices, construction cost inflation, and any economic shocks could keep annual sales closer to 4 million than 5 million for the foreseeable future.
What Home Buyers Search for in a Potential Property
Even during the times of high mortgage rates, most people don’t just randomly pick what’s available on the market. What buyers look for in a property has changed dramatically.
But what’s the real deal maker? Apparently, it is the location. 71% of real estate purchasers claim that the surrounding neighborhood is the most important aspect. They opt for low crime rates, proximity to parks, and walkability. Good schools, short commute, and access to public transport are other no-less-significant factors. Without doubt, a monthly mortgage payment is a huge factor that home buyers weigh in before purchasing a property.
And let us tell you, layout is not the last thing. The number of bedrooms and bathrooms, a functional kitchen, and the presence of a garage are no less important when it comes to choosing a home.
As a potential home buyer, you can check the property you want to buy on Rew Online, a real estate intelligence platform. There, it’s easy to find a residence’s value and price, assess the condition, and learn about the condition of the houses in the area. In addition, the platform also makes it easy to get hold of the contact details of the current homeowners in case you’ve got any questions about potential purchasing.
Frequently Asked Questions
Do Americans have $35 trillion in home equity?
Yes, according to the data tracked by the Federal Reserve, the total collective home equity held by Americans stands at $34.9 trillion. This is an absolute all-time historic high. As stated by experts, this equity boom is the result of the 2023-2024 housing slowdown. Because a shortage of available homes kept buyers competing over few listings, home values have surged.
Do condos and townhomes count in existing home sales numbers?
Yes. NAR’s existing home sales series includes single-family homes, townhomes, condos, and co-ops, as long as they are previously owned properties and the sale has closed. This comprehensive sample is what makes the report the most widely cited page for housing market data in the nation.
Are cash purchases included in annual home sales data?
Cash transactions are fully included in both monthly and annual existing home sales figures, alongside financed purchases with mortgages. For instance, according to the National Mortgage Professional, all-cash transactions in the United States accounted for 32.8% of sales in the first half of 2025.
What does “SAAR” mean in monthly housing market reports?
SAAR stands for seasonally adjusted annual rate. SAAR takes a one-month snapshot of home sales and converts it into an annualized number while adjusting for normal seasonal patterns.
Which region of the United States accounts for the most home sales?
The South is typically the region with the largest share of home sales. It consistently dominates US housing transactions because it has faster population growth, more new construction (especially in Texas, Florida, and North Carolina), and relatively lower prices compared to the West and Northeast.
But even though the South is at the top of the list in home sales, the West (especially California) often leads in total dollar value of transactions and median home prices.
The post How Many Homes Are Sold in the US Each Year? appeared first on Real Estate Weekly.