Cloudiest U.S. Cities for Home Buyers: Holland, Syracuse & Anchorage Climate Trends

Key takeaways
- Holland, Syracuse, and Anchorage are the cloudiest cities in the U.S., with mostly gray skies for around 270 days a year. - The cloudiest cities cluster around the Great Lakes and the Pacific Northwest, where rain and snow are common. - Climate also moves housing markets. Pandemic-era demand for sunshine and affordability pushed home prices up across the Sun Belt, pricing many buyers out. Weather shapes more than your commute. A city's climate can define its identity and the habits of the people who live there. Seattle is the obvious example. Its drizzle and gray skies have become a reputation in their own right, and the coffee-shop culture seems to grow out of that same damp routine. Miami sits at the other extreme, known for heat, sun, and a steady stream of beachgoers and snowbirds.The cloudiest cities in the U.S.
Here's the thing about the cloud rankings: they don't line up neatly with the places people assume are gloomy. Holland, Michigan, tops the list with 273 cloudy days a year. Syracuse and Anchorage follow closely, and Anchorage has the highest estimated annual cloud cover at 77.2%. The full ranking is below. (The methodology section at the end explains how a "cloudy" day is defined.) | City | Average cloudy days per year | Share of possible sunshine | Estimated annual cloud cover | |---|---|---|---| | Holland, MI | 273 | 44% | 76.6% | | Syracuse, NY | 272 | 42% | 76.3% | | Anchorage, AK | 269 | 39% | 77.2% | | Rochester, NY | 268 | 42% | 76.0% | | Muskegon, MI | 261 | 45% | 74.2% | | Jamestown, NY | 258 | 43% | 72.7% | | Cleveland, OH | 256 | 42% | 72.7% | | Seattle, WA | 250 | 43% | 68.2% | | Kalispell, MT | 250 | 50% | 67.5% | | Longview, WA | 245 | 43% | 68.2% | Anchorage looks gloomier once you factor in how much sunlight actually gets through. Measure by the share of time sunlight reaches the ground and Anchorage moves to the top, followed by Syracuse, Rochester, and Seattle. The cloud-cover numbers and the sunshine numbers don't always agree, so pick the metric that matches what you care about before you compare cities.Why these cities stay gray
Almost every city on the cloudy list sits next to the Great Lakes or the Pacific Ocean. That's not a coincidence. Two mechanisms do most of the work: - Proximity to large bodies of water helps clouds form and feeds frequent storm systems, especially in fall and winter. - Cold air often moves over warmer water, a setup that produces persistent cloud cover. The details vary by place. Anchorage spends over 65% of the year under dense cloud cover, mostly because of atmospheric rivers and moisture from the Pacific. What surprises people is that its cloudiest stretch comes in summer, not winter. The Seattle area is sometimes cited as the cloudiest region in the country. It gets a similar ocean influence to Anchorage, but it's sunnier in summer and cloudier in winter. The ranking here uses recent satellite averages rather than older records, which is why the results differ from earlier rankings. The Great Lakes cities work differently. Holland, Syracuse, and Rochester sit downwind of the lakes. Cooler air blows across the relatively milder water, picks up moisture, and forms clouds that often drop rain or snow. Meteorologists call this the lake effect. It's most common from late fall through early spring, and it can bring very heavy precipitation. Kalispell is the odd one out. It sits deep in the Rocky Mountains, far from any major water source, so the lake and ocean explanations don't fit. Instead, the Flathead Valley where it sits is prone to frequent temperature inversions. Cool air gets trapped in the valley and produces cloudy, foggy weather for days at a stretch, mostly in winter.Why cloudiness matters when choosing where to live
Climate touches everything from your daily routine to your mood and well-being. Big cities can even generate their own weather, producing clouds of their own or running hotter than the surrounding countryside. But reputation and reality often diverge. Take Seattle. Despite its rainy image, it gets roughly 39 inches of precipitation a year, about what a typical American city receives and far less than New York, Boston, or Atlanta. Its gloom comes mostly from lingering cloud cover and frequent drizzle, not heavy rain. Miami is the reverse case. It gets only slightly more sunny days than the national median, which is a far cry from its sunny reputation. Climate also reshapes housing markets, and that's where the story gets more practical. During the pandemic, many coastal buyers and remote workers moved toward Sun Belt cities chasing sunshine and affordability. Prices climbed until demand peaked, and then began to fall as buyers got priced out. Now some cloudier, more affordable cities in the Midwest and Northeast are gaining popularity. The sun-seekers who left the Northeast are, in a sense, coming back to it, or at least to its prices. If you're weighing a move, you can check sunshine and other local climate data on Redfin.com. Click any home listing to see typical sunshine hours by season, or open a simulated 3D model showing how sunlight hits the property through the day. Redfin works with Shadowmap, the Weather Company, and First Street (now owned by MSCI) to display this data for nearly every property in the U.S.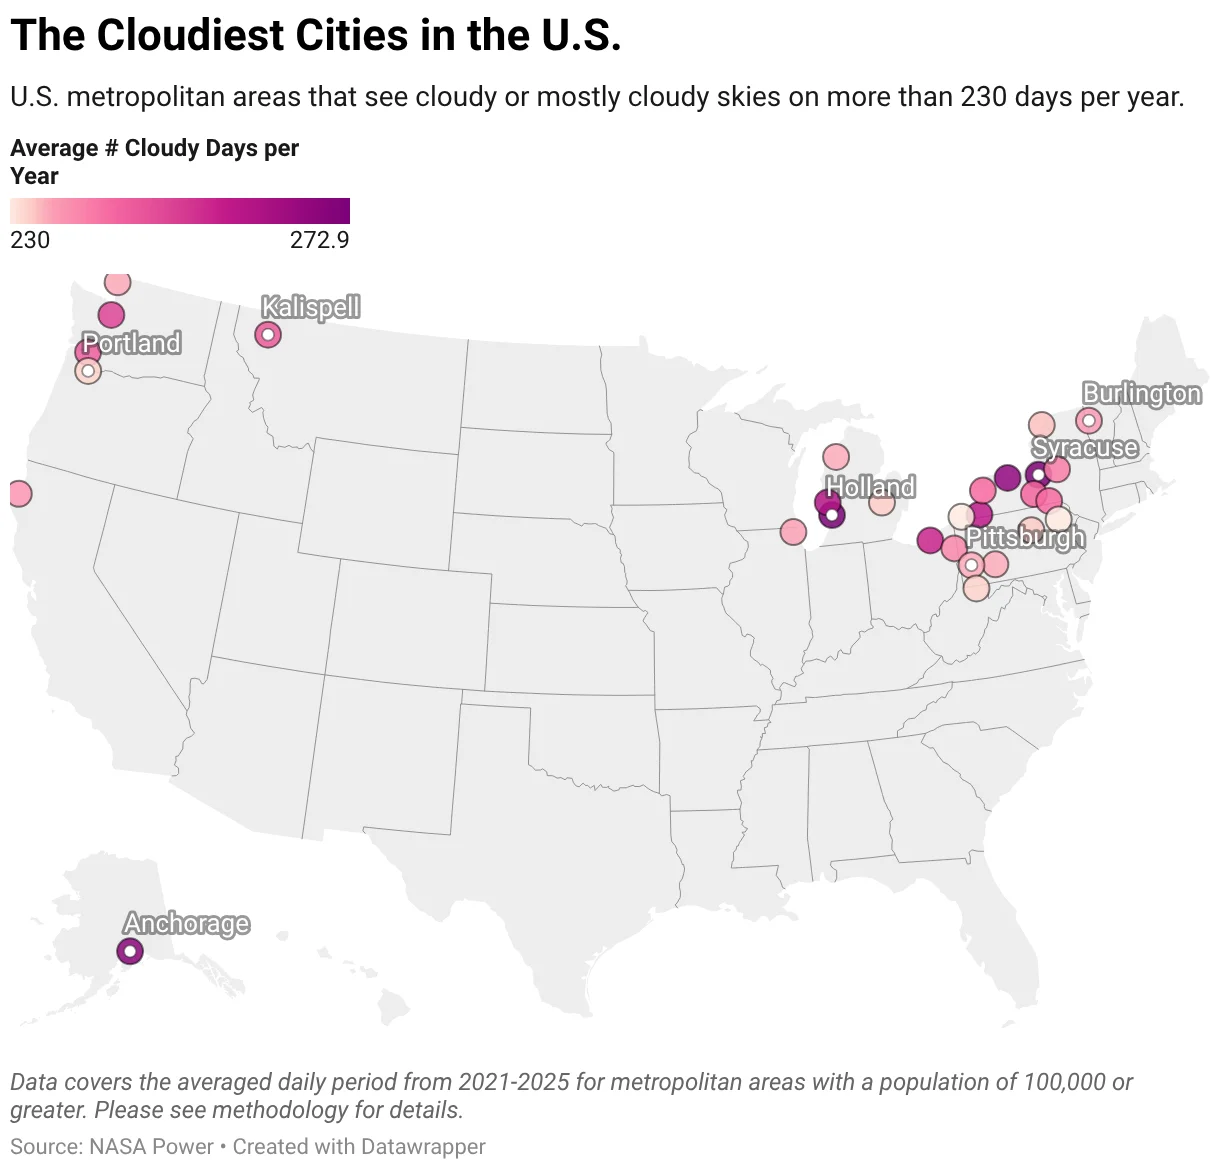
Cold Bay: the cloudiest place in the country
The outright cloudiest place in the United States is Cold Bay, Alaska, a small town in the Aleutian Islands. It logs 304 cloudy days a year, and on a typical day, cloud cover blankets more than 75% of daylight hours. That puts it ahead of every city in the ranking above. The town also recently had its cloudiest start to summer in over 30 years. Cold Bay has more history than its weather suggests. It hosted an air base during World War II, much of which still stands. The surrounding region also has large parks and wildlife preserves that draw people looking for recreation and adventure. The Aleutians are also facing some of the most dramatic effects of climate change, including biodiversity loss. The islands already have a very windy, wild, and highly varied climate, shaped by the semi-permanent Aleutian Low. Expect it to become more extreme and less predictable in the coming decades.How cloudiness is measured
Cloudiness is usually sorted into three categories: partly cloudy, mostly cloudy, and cloudy, with overcast reserved for the darkest skies. These categories are the basis for the day counts in the rankings, so if a city's number surprises you, check which category it's counted in before you draw conclusions.How the sky-cover scale sorts the days
Everything in this ranking hinges on a simple sky-cover scale, so it's worth getting straight before the numbers arrive. A partly cloudy day has clouds covering 3/8 to 5/8 of the sky. A mostly cloudy day runs from 5/8 to 7/8. A cloudy day has 7/8 or more of the sky under cloud.
- Partly cloudy: 3/8 to 5/8 of the sky is covered by clouds.
- Mostly cloudy: 5/8 to 7/8 of the sky is covered by clouds.
- Cloudy: 7/8 or more of the sky is covered by clouds.
What actually decides the ranking
Only one number drives the order: the combined average annual count of "mostly cloudy" and "cloudy" days. That's it. A city with a lot of partly cloudy weather doesn't get credit for it, and a place that's heavily overcast for a few months can still rank lower than one with steady gray. Metro areas with populations over 100,000 were the only ones in the running.
That choice is a deliberate one, and it's a sensible one. Counting the heavy-cloud days captures how often the sky is actually oppressive, rather than how often it's merely hazy or broken up. If you're deciding whether a city feels gloomy, that's the distinction you care about.
The supporting metrics, and why they sit outside the ranking
The analysis also reports three other measures: estimated cloud cover, percent of possible sunshine, and clear-sky index. None of them touch the rankings. They're there for context, and they're measured only during daylight hours.
- Estimated cloud cover is the average hourly share of the sky covered by clouds, measured from 2001 to 2025.
- Percent of possible sunshine is calculated by dividing the estimated minutes of recorded sunshine reaching the ground by the total possible sunshine minutes between sunrise and sunset. The estimate combines NASA's monthly clearness index with the Angstrom–Prescott relation, using standard FAO-56 coefficients. Results are combined across 12 months and weighted by daylight hours.
- Clear-sky index, also called the cloud modification factor, compares the sunlight actually reaching the ground with what would reach it under a clear sky. The lower the index, the cloudier the location.
Why leave these out of the ranking? Because they measure related but different things. Cloud cover tells you how much sky is blocked on average. Sunshine percentage tells you how much usable light gets through. A city can score well on one and poorly on another, and folding them into a single score would blur that. Still, if you want a second opinion on the rankings, these three are where you'd look.
Where the data gets blurry
The source data comes from NASA Power, covering 2001 to 2025 and aggregated into monthly averages. NASA Power draws on satellite-derived measurements of global atmospheric conditions, gridded at 1° by 1°, roughly 110 km by 85 km per cell.
That resolution is the catch. Cells that large can't separate neighboring metros, so nearby cities sometimes receive identical values. When that happened here, the cities were grouped under the largest metro in the cluster. That's a reasonable fix, but it means the ranking can't tell apart two cities that happen to share a grid cell. If you're comparing suburbs or metros in the same region, treat small gaps in the results with suspicion.
And yet the broad picture holds up. A roughly 110-kilometer grid is blunt, but cloud patterns in the U.S. don't shift that quickly, so the big contrasts between regions are likely to survive the coarseness. What's less certain is the fine ordering in the middle of the list. If you're picking a city to relocate to based on a few places ranked close together, the sky is probably not the only thing you should be weighing.